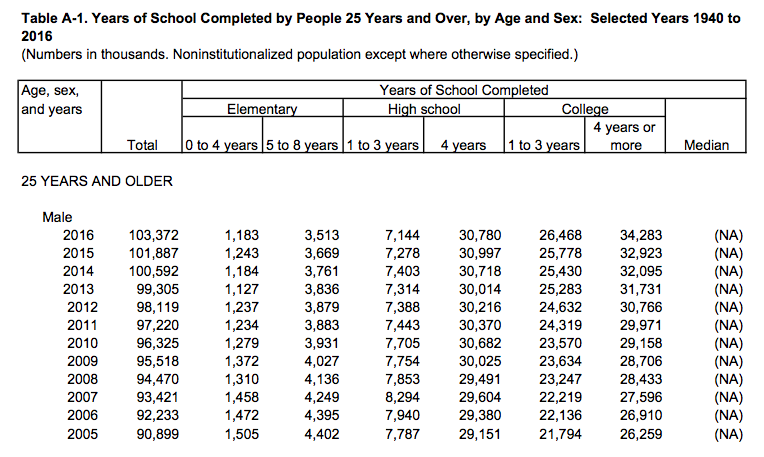
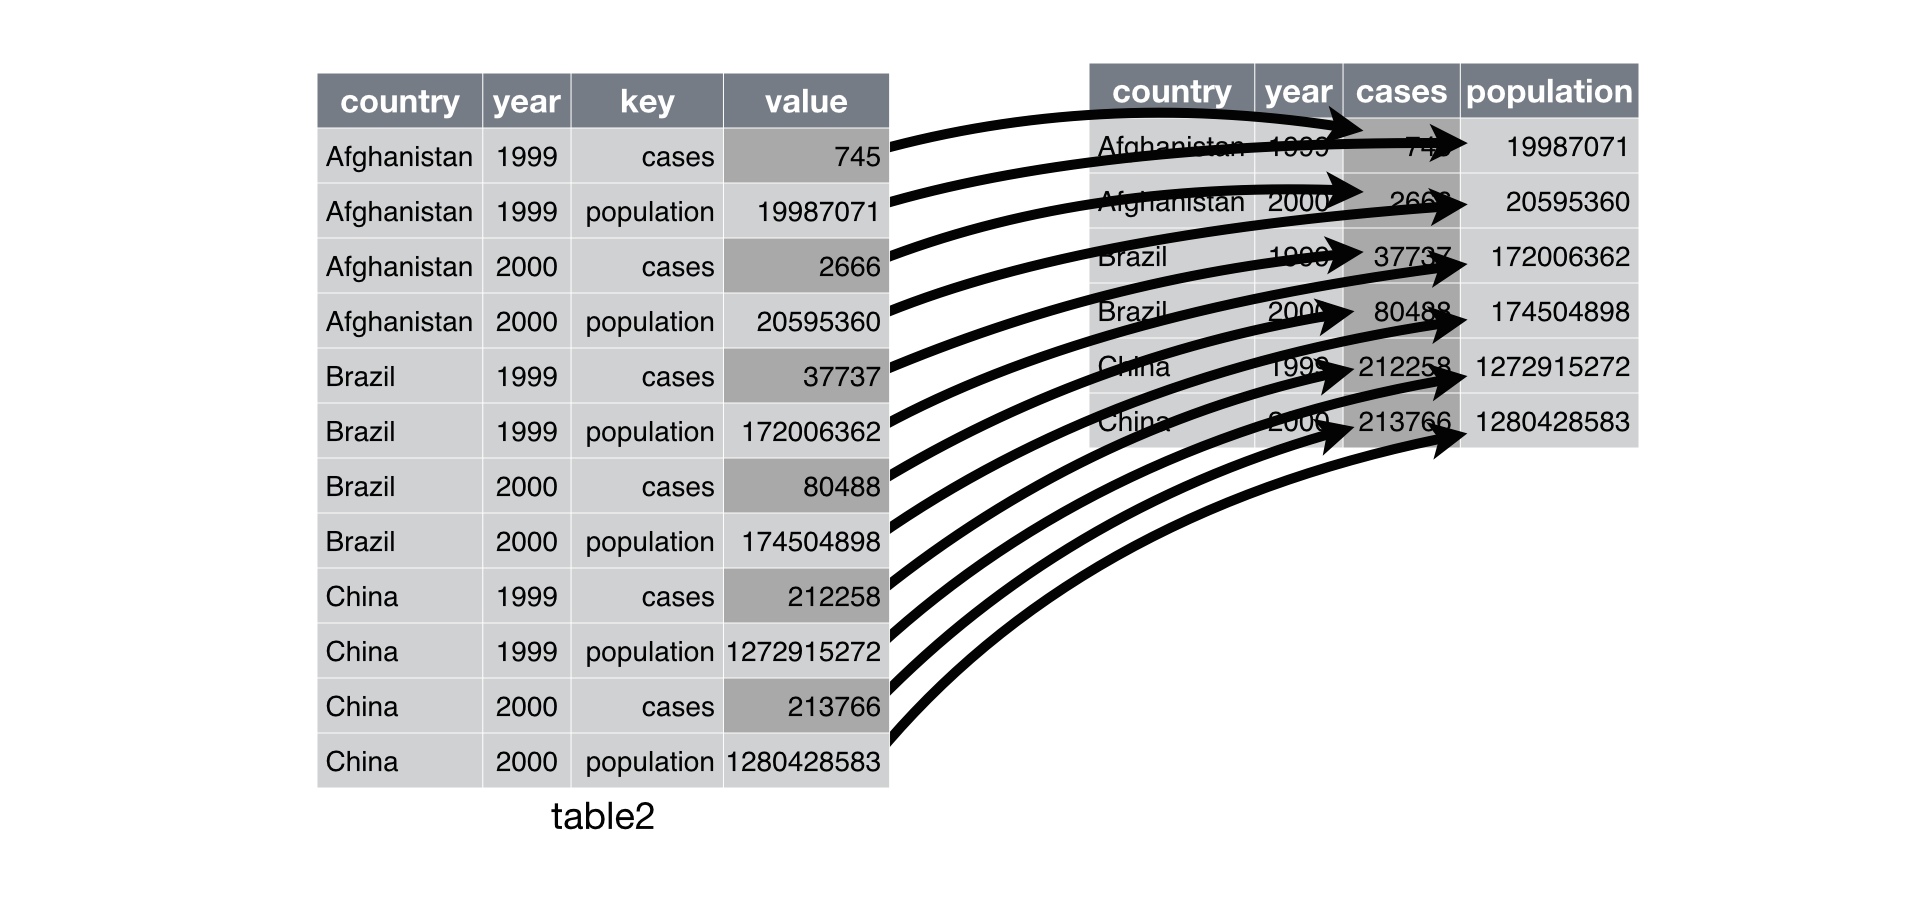
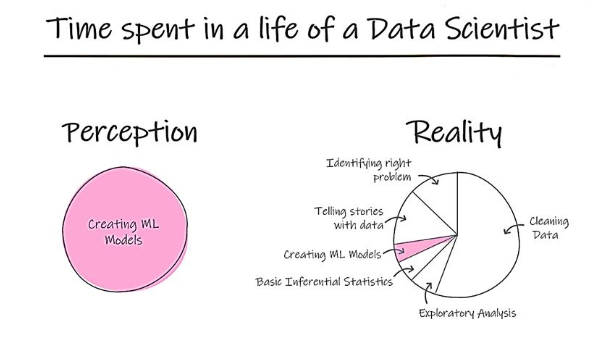
class: center, middle, inverse, title-slide .title[ # Lecture 18: Tidy Data ] .author[ ### Robin Liu ] .institute[ ### UCSB ] .date[ ### 2022-07-21 ] --- class: inverse, middle, center # Tidy Data https://r4ds.had.co.nz/tidy-data.html --- # Tidy Data We can create a tibble by row as follows: ```r # library(tidyverse) table1 <- tribble( ~country, ~year, ~cases, ~population, "Afghanistan", 1999, 745, 19987071, "Afghanistan", 2000, 2666, 20595360, "Brazil", 1999, 37737, 172006362, "Brazil", 2000, 80488, 174504898, "China", 1999, 212258, 1272915272, "China", 2000, 213766, 1280428583 ) ``` --- # Tidy Data ```r table1 ``` ``` ## # A tibble: 6 x 4 ## country year cases population ## <chr> <dbl> <dbl> <dbl> ## 1 Afghanistan 1999 745 19987071 ## 2 Afghanistan 2000 2666 20595360 ## 3 Brazil 1999 37737 172006362 ## 4 Brazil 2000 80488 174504898 ## 5 China 1999 212258 1272915272 ## 6 China 2000 213766 1280428583 ``` Each row is an **observation**, or **case**. An observation is a country-year. Each column is a **variable**. They specify attributes of a particular case. --- # Tidy Data We are now very familiar with the following operations: .pull-left[ ```r # rate per 10,000 table1 |> mutate(rate = cases / population * 10000) ``` ``` ## # A tibble: 6 x 5 ## country year cases population rate ## <chr> <dbl> <dbl> <dbl> <dbl> ## 1 Afghanistan 1999 745 19987071 0.373 ## 2 Afghanistan 2000 2666 20595360 1.29 ## 3 Brazil 1999 37737 172006362 2.19 ## 4 Brazil 2000 80488 174504898 4.61 ## 5 China 1999 212258 1272915272 1.67 ## 6 China 2000 213766 1280428583 1.67 ``` ] -- .pull-right[ ```r table1 |> group_by(country) |> summarize(case_mean = mean(cases)) ``` ``` ## # A tibble: 3 x 2 ## country case_mean ## <chr> <dbl> ## 1 Afghanistan 1706. ## 2 Brazil 59112. ## 3 China 213012 ``` ] --- # Tidy Data These operations are easy to do because the data is **tidy**. The R language, and `tidyverse` specifically, work best with data in the tidy format (hence the name). -- ## A dataset is tidy if: 1. Each variable has its own column 1. Each observation has its own row .center[] --- # Tidy Data |name | treatmentA| treatmentB| |:------------|----------:|----------:| |John Smith | NA| 18| |Jane Doe | 4| 1| |Mary Johnson | 6| 7| -- not tidy -- |treatment | John Smith| Jane Doe| Mary Johnson| |:---------|----------:|--------:|------------:| |a | NA| 4| 6| |b | 18| 1| 7| -- still not tidy --- # Tidy Data ### Tidy |name |treatment | value| |:------------|:---------|-----:| |Jane Doe |a | 4| |Jane Doe |b | 1| |John Smith |a | NA| |John Smith |b | 18| |Mary Johnson |a | 6| |Mary Johnson |b | 7| -- Each row is a case. Each column is a variable. "a" and "b" are levels of the treatment variable. -- Sometimes called *long format*. --- # Tidy Data .pull-left[ |name | treatmentA| treatmentB| |:------------|----------:|----------:| |John Smith | NA| 18| |Jane Doe | 4| 1| |Mary Johnson | 6| 7| ] .pull-right[ |name |treatment | value| |:------------|:---------|-----:| |Jane Doe |a | 4| |Jane Doe |b | 1| |John Smith |a | NA| |John Smith |b | 18| |Mary Johnson |a | 6| |Mary Johnson |b | 7| ] -- Tidy data is more amenable to data analysis, especially in R. "Untidy" data is more compact. It is not necessarily bad. Most real datasets are untidy to begin with. --- # Tidy Data .center[] --- # Tidy Data So far we have only looked at tidy data. - mtcars, nycflights13, gapminder, iris, ... -- The process of transforming "raw" data into a form amenable to analysis is called **data munging** or **data wrangling**. -- Some say it comprises up to 90% of data science. --- class: inverse, middle, center # Data Wrangling --- # Data Wrangling ```r table2 <- tribble( ~country, ~year, ~type, ~count, "Afghanistan", 1999, "cases", 745, "Afghanistan", 1999, "population", 19987071, "Afghanistan", 2000, "cases", 2666, "Afghanistan", 2000, "population", 20595360, "Brazil", 1999, "cases", 37737, "Brazil", 1999, "population", 172006362, "Brazil", 2000, "cases", 80488, "Brazil", 2000, "population", 174504898, "China", 1999, "cases", 212258, "China", 1999, "population", 1272915272, "China", 2000, "cases", 213766, "China", 2000, "population", 1280428583 ) ``` Not tidy: a single observation is spread across two rows. Cases and population are separate variables. We want to make the tibble *wider*. --- # Data Wrangling We will use `tidyr::pivot_wider()`, part of `tidyverse`. ```r table2 |> pivot_wider(names_from = type, values_from = count) ``` ``` ## # A tibble: 6 x 4 ## country year cases population ## <chr> <dbl> <dbl> <dbl> ## 1 Afghanistan 1999 745 19987071 ## 2 Afghanistan 2000 2666 20595360 ## 3 Brazil 1999 37737 172006362 ## 4 Brazil 2000 80488 174504898 ## 5 China 1999 212258 1272915272 ## 6 China 2000 213766 1280428583 ``` --- # Data Wrangling .center[] --- # Data Wrangling Untidy data can be spread across different tables. ```r # cases table table3a <- tribble( ~country, ~`1999`, ~`2000`, "Afghanistan", 745, 2666, "Brazil", 37737, 80488, "China", 212258, 213766, ) # population table table3b <- tribble( ~country, ~`1999`, ~`2000`, "Afghanistan", 19987071, 20595360, "Brazil", 172006362, 174504898, "China", 1272915272, 1280428583, ) ``` Untidy because the "year" is spread across multiple columns. We need to make this tibble *longer*. --- # Data Wrangling ```r table3a |> pivot_longer(c(`1999`, `2000`), names_to = "year", values_to = "cases") ``` ``` ## # A tibble: 6 x 3 ## country year cases ## <chr> <chr> <dbl> ## 1 Afghanistan 1999 745 ## 2 Afghanistan 2000 2666 ## 3 Brazil 1999 37737 ## 4 Brazil 2000 80488 ## 5 China 1999 212258 ## 6 China 2000 213766 ``` .center[] --- # Data Wrangling ```r table3a |> pivot_longer(c(`1999`, `2000`), names_to = "year", values_to = "cases") ``` ``` ## # A tibble: 6 x 3 ## country year cases ## <chr> <chr> <dbl> ## 1 Afghanistan 1999 745 ## 2 Afghanistan 2000 2666 ## 3 Brazil 1999 37737 ## 4 Brazil 2000 80488 ## 5 China 1999 212258 ## 6 China 2000 213766 ``` ```r table3b |> pivot_longer(c(`1999`, `2000`), names_to = "year", values_to = "population") ``` ``` ## # A tibble: 6 x 3 ## country year population ## <chr> <chr> <dbl> ## 1 Afghanistan 1999 19987071 ## 2 Afghanistan 2000 20595360 ## 3 Brazil 1999 172006362 ## 4 Brazil 2000 174504898 ## 5 China 1999 1272915272 ## 6 China 2000 1280428583 ``` --- # Data Wrangling .pull-left[ ```r table3a_long ``` ``` ## # A tibble: 6 x 3 ## country year cases ## <chr> <chr> <dbl> ## 1 Afghanistan 1999 745 ## 2 Afghanistan 2000 2666 ## 3 Brazil 1999 37737 ## 4 Brazil 2000 80488 ## 5 China 1999 212258 ## 6 China 2000 213766 ``` ] .pull-right[ ```r table3b_long ``` ``` ## # A tibble: 6 x 3 ## country year population ## <chr> <chr> <dbl> ## 1 Afghanistan 1999 19987071 ## 2 Afghanistan 2000 20595360 ## 3 Brazil 1999 172006362 ## 4 Brazil 2000 174504898 ## 5 China 1999 1272915272 ## 6 China 2000 1280428583 ``` ] To get the entire tidy dataset, we should *join* on country and year. Remember the cases are country-years. --- # Data Wrangling ```r table3a_long |> inner_join(table3b_long, by = c("country", "year")) ``` ``` ## # A tibble: 6 x 4 ## country year cases population ## <chr> <chr> <dbl> <dbl> ## 1 Afghanistan 1999 745 19987071 ## 2 Afghanistan 2000 2666 20595360 ## 3 Brazil 1999 37737 172006362 ## 4 Brazil 2000 80488 174504898 ## 5 China 1999 212258 1272915272 ## 6 China 2000 213766 1280428583 ``` Tidy :) --- # Data Wrangling ```r table4 <- tribble( ~country, ~year, ~rate, "Afghanistan", 1999, "745/19987071", "Afghanistan", 2000, "2666/20595360", "Brazil", 1999, "37737/172006362", "Brazil", 2000, "80488/174504898", "China", 1999, "212258/1272915272", "China", 2000, "213766/1280428583" ) ``` Not tidy: one column `rate` contains two variables, `cases` and `population`. `rate` should be *separated* into two columns. -- It is fine to have a "rate" column in a tibble. But the string representation strongly suggests two variables. --- # Data Wrangling ```r table4 |> separate(rate, into = c("cases", "population")) ``` ``` ## # A tibble: 6 x 4 ## country year cases population ## <chr> <dbl> <chr> <chr> ## 1 Afghanistan 1999 745 19987071 ## 2 Afghanistan 2000 2666 20595360 ## 3 Brazil 1999 37737 172006362 ## 4 Brazil 2000 80488 174504898 ## 5 China 1999 212258 1272915272 ## 6 China 2000 213766 1280428583 ``` By default, `separate` will split values based on non-alphanumeric characters, in this case the forward slash `/`. -- There is a problem with the above; `cases` and `population` should be numeric. --- # Data Wrangling ```r table4 |> separate(rate, into = c("cases", "population"), convert = TRUE) ``` ``` ## # A tibble: 6 x 4 ## country year cases population ## <chr> <dbl> <int> <int> ## 1 Afghanistan 1999 745 19987071 ## 2 Afghanistan 2000 2666 20595360 ## 3 Brazil 1999 37737 172006362 ## 4 Brazil 2000 80488 174504898 ## 5 China 1999 212258 1272915272 ## 6 China 2000 213766 1280428583 ``` Tidy :) --- # Data Wrangling For completeness, there is also a `unite` function which does the opposite. .pull-left[ ```r table4_tidy ``` ``` ## # A tibble: 6 x 4 ## country year cases population ## <chr> <int> <int> <int> ## 1 Afghanistan 1999 745 19987071 ## 2 Afghanistan 2000 2666 20595360 ## 3 Brazil 1999 37737 172006362 ## 4 Brazil 2000 80488 174504898 ## 5 China 1999 212258 1272915272 ## 6 China 2000 213766 1280428583 ``` ] -- .pull-right[ ```r table4_tidy |> unite(rate, cases, population, sep = "/") ``` ``` ## # A tibble: 6 x 3 ## country year rate ## <chr> <int> <chr> ## 1 Afghanistan 1999 745/19987071 ## 2 Afghanistan 2000 2666/20595360 ## 3 Brazil 1999 37737/172006362 ## 4 Brazil 2000 80488/174504898 ## 5 China 1999 212258/1272915272 ## 6 China 2000 213766/1280428583 ``` ] --- # Data Wrangling `pivot_wider`, `pivot_longer`, `separate`, `unite` are functions in the `tidyr` package, part of `tidyverse`. Aims to streamline these operations and minimize the time spent on data wrangling. Without these tools, one may have to write custom code for each dataset, which is time consuming. .center[] --- # Case Study Untidy data from [2014 World Health Organization Global Tuberculosis Report](https://www.who.int/teams/global-tuberculosis-programme/data) ```r tidyr::who ``` ``` ## # A tibble: 7,240 x 60 ## country iso2 iso3 year new_sp_m014 new_sp_m1524 new_sp_m2534 new_sp_m3544 ## <chr> <chr> <chr> <int> <int> <int> <int> <int> ## 1 Afghani~ AF AFG 1980 NA NA NA NA ## 2 Afghani~ AF AFG 1981 NA NA NA NA ## 3 Afghani~ AF AFG 1982 NA NA NA NA ## 4 Afghani~ AF AFG 1983 NA NA NA NA ## 5 Afghani~ AF AFG 1984 NA NA NA NA ## 6 Afghani~ AF AFG 1985 NA NA NA NA ## 7 Afghani~ AF AFG 1986 NA NA NA NA ## 8 Afghani~ AF AFG 1987 NA NA NA NA ## 9 Afghani~ AF AFG 1988 NA NA NA NA ## 10 Afghani~ AF AFG 1989 NA NA NA NA ## # ... with 7,230 more rows, and 52 more variables: new_sp_m4554 <int>, ## # new_sp_m5564 <int>, new_sp_m65 <int>, new_sp_f014 <int>, ## # new_sp_f1524 <int>, new_sp_f2534 <int>, new_sp_f3544 <int>, ## # new_sp_f4554 <int>, new_sp_f5564 <int>, new_sp_f65 <int>, ## # new_sn_m014 <int>, new_sn_m1524 <int>, new_sn_m2534 <int>, ## # new_sn_m3544 <int>, new_sn_m4554 <int>, new_sn_m5564 <int>, ## # new_sn_m65 <int>, new_sn_f014 <int>, new_sn_f1524 <int>, ... ``` --- # Case Study Typical real-life data. - Redundant columns - Strange variable codes - many missing values Good place to start: identify columns that are values and not variables. Cases appear to be country-years. Hence `country`, `iso2`, `iso3`, and `year` are variables. For now, treat all others as values. --- # Case Study The other columns range from `new_sp_m014` to `newrel_f65`. Let's put them in a single column `key`. ``` ## # A tibble: 76,046 x 6 ## country iso2 iso3 year key cases ## <chr> <chr> <chr> <int> <chr> <int> ## 1 Afghanistan AF AFG 1997 new_sp_m014 0 ## 2 Afghanistan AF AFG 1997 new_sp_m1524 10 ## 3 Afghanistan AF AFG 1997 new_sp_m2534 6 ## 4 Afghanistan AF AFG 1997 new_sp_m3544 3 ## 5 Afghanistan AF AFG 1997 new_sp_m4554 5 ## 6 Afghanistan AF AFG 1997 new_sp_m5564 2 ## 7 Afghanistan AF AFG 1997 new_sp_m65 0 ## 8 Afghanistan AF AFG 1997 new_sp_f014 5 ## 9 Afghanistan AF AFG 1997 new_sp_f1524 38 ## 10 Afghanistan AF AFG 1997 new_sp_f2534 36 ## # ... with 76,036 more rows ``` --- # Case Study We must look at the [*data dictionary*](https://www.who.int/teams/global-tuberculosis-programme/data) or *codebook* to figure out the values. First three letters - `new` or `old` cases of TB. We only have new cases in this dataset. -- Next two letters describe type of TB - `rel` cases of relapse - `ep` cases of extrapulmonary TB - `sn` cases of pulmonary TB not detected by a smear (smear negative) - `sp` cases of pulmonary TB detected by a smear (smear positive) -- Sixth letter describes sex of patient: `m` or `f` -- Remaining letters give the age group. - `014` = 0 to 14 years old - ... - `5564` = 55 to 64 years old - `65` = 65 or older. --- # Case Study Separate `key` according to the data dictionary. ``` ## Warning: Expected 3 pieces. Missing pieces filled with `NA` in 2580 rows [243, ## 244, 679, 680, 681, 682, 683, 684, 685, 686, 687, 688, 689, 690, 691, 692, 903, ## 904, 905, 906, ...]. ``` ``` ## # A tibble: 76,046 x 8 ## country iso2 iso3 year new type sexage cases ## <chr> <chr> <chr> <int> <chr> <chr> <chr> <int> ## 1 Afghanistan AF AFG 1997 new sp m014 0 ## 2 Afghanistan AF AFG 1997 new sp m1524 10 ## 3 Afghanistan AF AFG 1997 new sp m2534 6 ## 4 Afghanistan AF AFG 1997 new sp m3544 3 ## 5 Afghanistan AF AFG 1997 new sp m4554 5 ## 6 Afghanistan AF AFG 1997 new sp m5564 2 ## 7 Afghanistan AF AFG 1997 new sp m65 0 ## 8 Afghanistan AF AFG 1997 new sp f014 5 ## 9 Afghanistan AF AFG 1997 new sp f1524 38 ## 10 Afghanistan AF AFG 1997 new sp f2534 36 ## # ... with 76,036 more rows ``` --- # Case Study Something went wrong. ```r who1[243:244, ] ``` ``` ## # A tibble: 2 x 6 ## country iso2 iso3 year key cases ## <chr> <chr> <chr> <int> <chr> <int> ## 1 Afghanistan AF AFG 2013 newrel_m014 1705 ## 2 Afghanistan AF AFG 2013 newrel_f014 1749 ``` We have `newrel` instead of `new_rel`. --- # Case Study Replace `newrel` with `new_rel`. Then, ``` ## # A tibble: 76,046 x 8 ## country iso2 iso3 year new type sexage cases ## <chr> <chr> <chr> <int> <chr> <chr> <chr> <int> ## 1 Afghanistan AF AFG 1997 new sp m014 0 ## 2 Afghanistan AF AFG 1997 new sp m1524 10 ## 3 Afghanistan AF AFG 1997 new sp m2534 6 ## 4 Afghanistan AF AFG 1997 new sp m3544 3 ## 5 Afghanistan AF AFG 1997 new sp m4554 5 ## 6 Afghanistan AF AFG 1997 new sp m5564 2 ## 7 Afghanistan AF AFG 1997 new sp m65 0 ## 8 Afghanistan AF AFG 1997 new sp f014 5 ## 9 Afghanistan AF AFG 1997 new sp f1524 38 ## 10 Afghanistan AF AFG 1997 new sp f2534 36 ## # ... with 76,036 more rows ``` --- # Case Study `new` is constant in this data set. For that matter, let's also drop `iso2` and `iso3` since we already have `country`. ``` ## # A tibble: 76,046 x 5 ## country year type sexage cases ## <chr> <int> <chr> <chr> <int> ## 1 Afghanistan 1997 sp m014 0 ## 2 Afghanistan 1997 sp m1524 10 ## 3 Afghanistan 1997 sp m2534 6 ## 4 Afghanistan 1997 sp m3544 3 ## 5 Afghanistan 1997 sp m4554 5 ## 6 Afghanistan 1997 sp m5564 2 ## 7 Afghanistan 1997 sp m65 0 ## 8 Afghanistan 1997 sp f014 5 ## 9 Afghanistan 1997 sp f1524 38 ## 10 Afghanistan 1997 sp f2534 36 ## # ... with 76,036 more rows ``` --- # Case Study Finally, split `sexage` into two columns, `sex` and `age`. ``` ## # A tibble: 76,046 x 6 ## country year type sex age cases ## <chr> <int> <chr> <chr> <chr> <int> ## 1 Afghanistan 1997 sp m 014 0 ## 2 Afghanistan 1997 sp m 1524 10 ## 3 Afghanistan 1997 sp m 2534 6 ## 4 Afghanistan 1997 sp m 3544 3 ## 5 Afghanistan 1997 sp m 4554 5 ## 6 Afghanistan 1997 sp m 5564 2 ## 7 Afghanistan 1997 sp m 65 0 ## 8 Afghanistan 1997 sp f 014 5 ## 9 Afghanistan 1997 sp f 1524 38 ## 10 Afghanistan 1997 sp f 2534 36 ## # ... with 76,036 more rows ``` -- Tidy :) --- # Case Study *Exercise:* Make the following plot. <img src="Lec18_files/figure-html/unnamed-chunk-34-1.png" style="display: block; margin: auto;" /> --- # Remarks Real data is a [mess](https://data.cityofnewyork.us/Health/DOHMH-Dog-Bite-Data/rsgh-akpg). -- Work with as much *raw*, unclean data as possible. https://github.com/rfordatascience/tidytuesday -- The `tidyverse` workflow from raw data to tidy data to `ggplot` is excellent. Underappreciated in the PSTAT department. https://www.tidyverse.org/ -- Amazingly, we haven't done any *statistics*. These visualization tools really shine when combined with statistical modeling. --- # Remarks This concludes the main content of the course. -- ## Next week - Monday: Lecture on a special topic in advanced R. - Tuesday: Practice exam administered in class under time constraint. - Wednesday: Go over practice exam in section. **No lecture.** - Thursday: Final exam. Bring pencil and one sheet/two sides of notes.