class: center, middle, inverse, title-slide .title[ # Welcome to PSTAT 10 ] .subtitle[ ## Lecture 1: The R ecosystem, Vectors ] .author[ ### Robin Liu ] .institute[ ### UCSB ] .date[ ### 2022-06-20 ] --- # A Job Ad  [link](https://jobs.apple.com/en-us/details/200311967/data-scientist-apple-finance-r-shiny) --- # A Job Ad 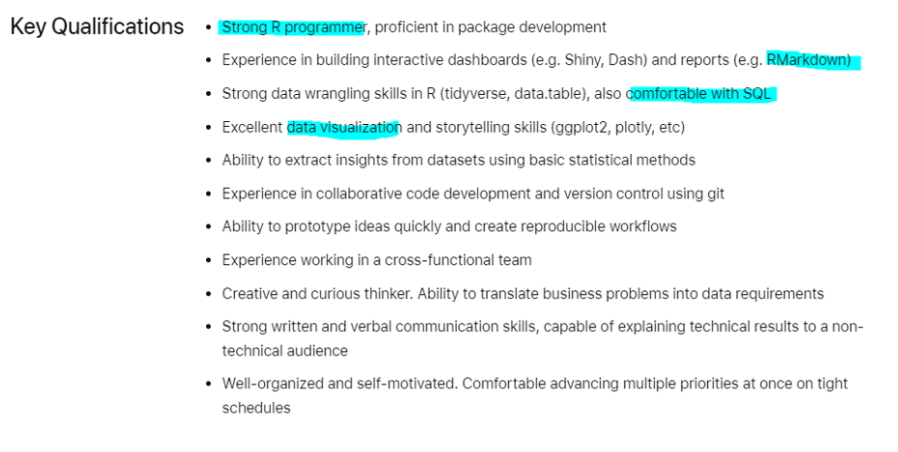 --- # About this class .pull-left[ ### Week 1 - R ecosystem, vectors, control flow - recycling, filtering, vectorization ] -- .pull-left[ ### Week 2 - Data frames and tibbles - `dplyr` and the pipe `|>` ] -- .pull-left[ ### Week 3 - Probability through simulation - Simulating random experiments ] -- .pull-left[ ### Week 4 - Structure of a database system - SQL select/where/join ] -- .pull-left[ ### Week 5 - Advanced topics - `ggplot`, the S3 class, SQL window functions, ... - Final exam (last day of class) ] --- # Grading - Lab worksheets 20% - Homework 50% - Final Exam 30% Lab worksheets are graded based on completion. I will release the worksheet solutions before their due date. -- ## Don't fall behind!! I have designed this class so that contents will build on top of each other. This means the lectures may refer to material in the lab worksheets or homework. Skipping an assignment will mean missing a large portion of the material. If you need help keeping up, please use office hours. --- # About me - PhD Student in the PSTAT department - Joined UCSB in Fall 2020 -- - Graduated in 2013 from the University of Michigan - Math and CS -- - Wrote my first line of code when I was 8 -- - Worked for many years as a software developer in industry --- 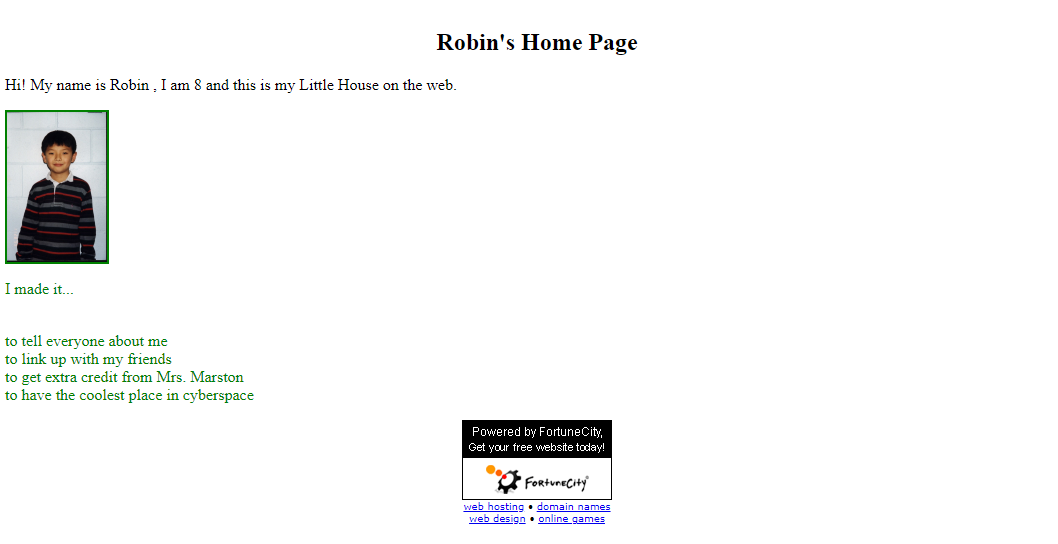 [link](https://web.archive.org/web/20120316051658/http://www.fortunecity.com/rainbow/jelly/117/) --- # Programming for data science 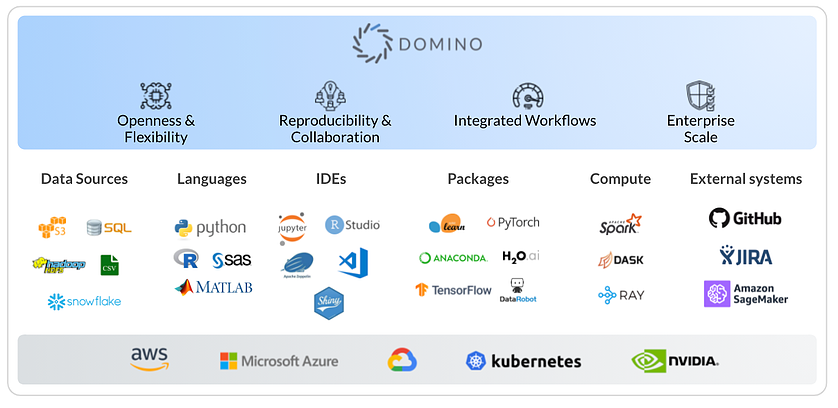 --- # Why R? - Designed for statistical research - R is open source - Large ecosystem (a lot of people use it) - Easy to simulate random experiments - Intuitive data exploration, manipulation, and plotting -- [The R Graph Gallery](https://r-graph-gallery.com)  --- # The R Ecosystem What does it mean to be **open source**? -- Not only is R free to use, you can **download its source code** - [https://mirror.las.iastate.edu/CRAN/sources.html](https://mirror.las.iastate.edu/CRAN/sources.html) -- A community of researchers continually add functionality in the form of **packages** These packages are also open source - [https://mirror.las.iastate.edu/CRAN/](https://mirror.las.iastate.edu/CRAN/) -- Many of our faculty at PSTAT have developed their own packages as part of their research *Exercise*: find out what packages and by whom. --- # The difficulty of teaching an intro class R contains **a lot** of functionality. I am still constantly finding out new things about R. It was hard to pick what to include and exclude from this class. I encourage you to look at functionality beyond the course material. Generally speaking, if your code produces correct output, it is correct. Unless the question asks for a particular method. https://twitter.com/hashtag/rstats --- # Use the help The `?` operator searches the documentation for the given function. This is displayed in the RStudio help window. What does the `seq_len` function do? ```r ?seq_len ``` <div class="countdown" id="timer_62b14cf9" style="right:0;bottom:0;" data-warnwhen="0"> <code class="countdown-time"><span class="countdown-digits minutes">01</span><span class="countdown-digits colon">:</span><span class="countdown-digits seconds">00</span></code> </div> --- # Use Google and StackOverflow These websites are your friends. Especially [StackOverflow](https://stackoverflow.com/). Searching for coding solutions online is a *skill*. 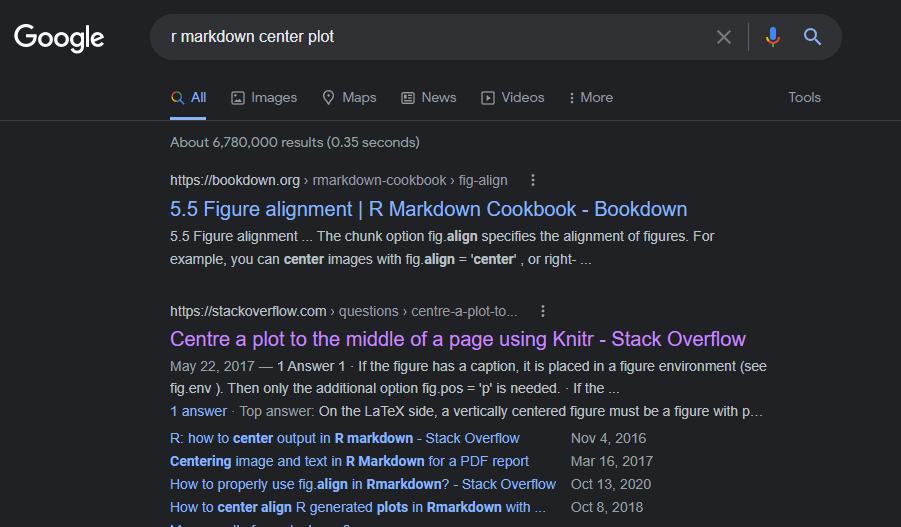 --- # Avoid copy pasting code I encourage you to work together and to search online for help. But avoid simply copy/pasting code. If you find some code you want to use, you must *type it in manually*. Typing the code character-for-character will teach you more than copy pasting. .center[] --- # Tools of the trade - **R console**: a program that *interprets* R code, one line at a time - **RStudio**: an *integrated development environment* (IDE) We will primarily use RStudio, but do note that the above are different things. .center[  ] [image credit](https://stats220.earo.me/01-intro.html#21) --- # Why come to class? ## How to draw an owl 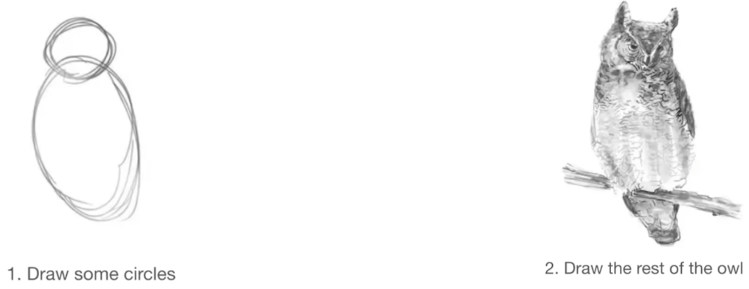 --- # Why come to class? ## How to draw an owl 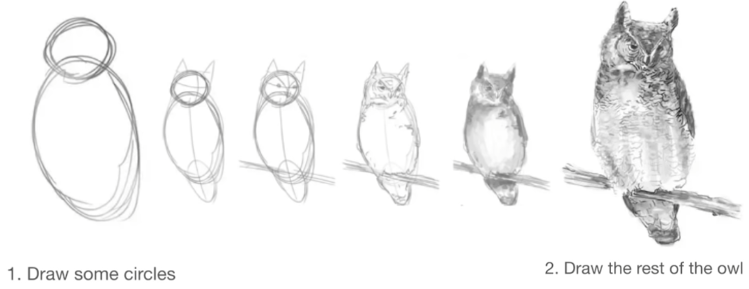 --- # Customize RStudio In RStudio, navigate to Tools > Global Options > Appearance and choose a theme that you like. I recommend a dark mode. Also adjust these settings: .center[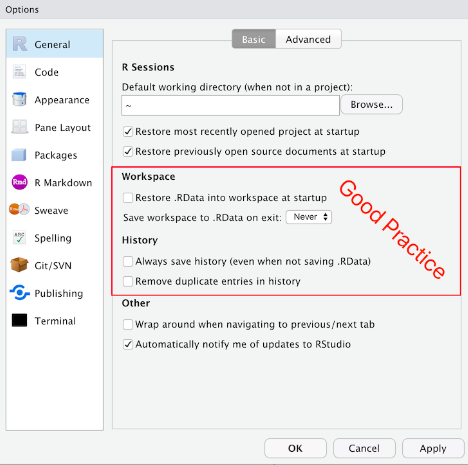] <div class="countdown" id="timer_62b14efa" style="right:0;bottom:0;" data-warnwhen="0"> <code class="countdown-time"><span class="countdown-digits minutes">05</span><span class="countdown-digits colon">:</span><span class="countdown-digits seconds">00</span></code> </div> --- # Installing a Package ```r install.packages("cowsay") ``` -- If you don't like this package... ```r remove.packages("cowsay") ``` *Exercise*: Where on your computer are these packages actually installed? --- class: inverse, middle, center # Week 1: Programming Concepts https://iqss.github.io/dss-workshops/R/Rintro/base-r-cheat-sheet.pdf --- # R as a calculator ```r 2 + 3 ``` ``` ## [1] 5 ``` -- ```r 2 * 3 ``` ``` ## [1] 6 ``` -- ```r 2^3 ``` ``` ## [1] 8 ``` -- ```r exp(4.2) # raise 4.2 to the power of e ``` ``` ## [1] 66.68633 ``` -- ```r log(exp(4.2)) ``` ``` ## [1] 4.2 ``` --- # Calculator ### Evaluate $$ \frac{5^7 - 2\sqrt{4}}{\log_2(100)} $$ *Hint*: Type `?log` and `?sqrt` in the console to access the help. <div class="countdown" id="timer_62b14d6a" style="right:0;bottom:0;" data-warnwhen="0"> <code class="countdown-time"><span class="countdown-digits minutes">05</span><span class="countdown-digits colon">:</span><span class="countdown-digits seconds">00</span></code> </div> --- # Assignment operator - Assignment operator: we usually want to save the result of an expression using `<-` - Three datatypes: Numeric, Character, Logical ```r hello <- "Hello world!" print(hello) ``` ``` # [1] "Hello world!" ``` ```r result <- 55 + 77 result # print function not needed if executing in the console ``` ``` # [1] 132 ``` ```r istrue <- 10 == 10 print(istrue) ``` ``` # [1] TRUE ``` --- # Assignment operator A trick I will sometimes use .pull-left[ ```r hello <- "Hello world!" hello ``` ``` ## [1] "Hello world!" ``` ] .pull-right[ ```r (hello <- "Hello world!") ``` ``` ## [1] "Hello world!" ``` ] -- ## The dreaded '+' in the console Run the following ```r hello <- "Hello world! ``` What happens? --- # Assignment operator This may be surprising... ```r my_vector <- c(5, 3, 7, 1, 0) sort(my_vector) ``` ``` ## [1] 0 1 3 5 7 ``` What is the new value of `my_vector`? -- ```r my_vector ``` ``` ## [1] 5 3 7 1 0 ``` `my_vector` was unchanged by `sort`! We must change it by hand: -- ```r my_vector <- sort(my_vector) ``` --- class: inverse, middle, center # Vectors The most fundamental data structure in R --- # Vectors Vectors are called *atomic* because they can contain only one data type. Ways to create (atomic) vectors: combine function, colon operator, seq, and rep .pull-left[ ```r vec_comb <- c(1, 2, 3, 4, 5, 6) print(vec_comb) ``` ``` ## [1] 1 2 3 4 5 6 ``` ```r vec_colon <- 1:6 print(vec_colon) ``` ``` ## [1] 1 2 3 4 5 6 ``` ```r vec_seq <- seq(1, 6, 2) print(vec_seq) ``` ``` ## [1] 1 3 5 ``` ] .pull-right[ ```r vec_seq2 <- seq_len(6) print(vec_seq2) ``` ``` ## [1] 1 2 3 4 5 6 ``` ```r vec_rep <- rep(1:3, 3) print(vec_rep) ``` ``` ## [1] 1 2 3 1 2 3 1 2 3 ``` ```r vec_rep_each <- rep(1:3, each = 3) print(vec_rep_each) ``` ``` ## [1] 1 1 1 2 2 2 3 3 3 ``` ] --- #Vectors Create a vector `x` containing values (1, 2, 6) and a vector `y` containing values (1, 1, 1). What is the result of the following? ```{r=eval=F} x + y ``` <div class="countdown" id="timer_62b15039" style="right:0;bottom:0;" data-warnwhen="0"> <code class="countdown-time"><span class="countdown-digits minutes">02</span><span class="countdown-digits colon">:</span><span class="countdown-digits seconds">00</span></code> </div> --- # Vectors ## length and typeof .pull-left[ ```r length(0:89) ``` ``` ## [1] 90 ``` ```r typeof(0:89) ``` ``` ## [1] "integer" ``` ```r length(c(TRUE, FALSE)) ``` ``` ## [1] 2 ``` ```r typeof(c(TRUE, FALSE)) ``` ``` ## [1] "logical" ``` ] .pull-right[ ```r length(100) ``` ``` ## [1] 1 ``` Scalars are length-one vectors Vector datatype hierarchy 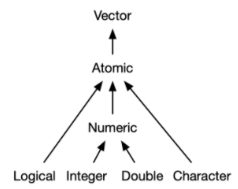 ] --- # Working with logicals A logical statement is either TRUE or FALSE .pull-left[ Comparing numerics ```r 10 > 10 ``` ``` ## [1] FALSE ``` ```r 10 >= 10 ``` ``` ## [1] TRUE ``` ```r 5 == 10 ``` ``` ## [1] FALSE ``` ```r 5 != 10 ``` ``` ## [1] TRUE ``` ] .pull-right[ Comparing strings ```r "cat" == "dog" ``` ``` ## [1] FALSE ``` ```r "cat" != "dog" ``` ``` ## [1] TRUE ``` ```r "cat" < "dog" # ?? best to avoid ``` ``` ## [1] TRUE ``` ] --- #Logicals ## Combining logical expressions ```r 5 < 10 & "cat" == "dog" # logical and ``` ``` ## [1] FALSE ``` ```r 5 < 10 | "cat" == "dog" # logical or ``` ``` ## [1] TRUE ``` --- #Logicals ## Weird but useful facts - TRUE and FALSE can be abbreviated T and F - FALSE has numeric value 0 - TRUE has numeric value 1 -- - What is TRUE + TRUE * FALSE + FALSE? -- ```r T + T * F + F ``` ``` ## [1] 1 ``` --- # Vectors ## Some built-in functions .pull-left[ ```r x <- 11:99 sum(x) ``` ``` ## [1] 4895 ``` ```r mean(x) ``` ``` ## [1] 55 ``` ```r median(x) ``` ``` ## [1] 55 ``` ```r summary(x) ``` ``` ## Min. 1st Qu. Median Mean 3rd Qu. Max. ## 11 33 55 55 77 99 ``` ] .pull-right[ ```r y <- c(T, F, F, T, T) sum(y) ``` ``` ## [1] 3 ``` ] --- # Vectors ## Subsetting ```r x <- c(1, 3, 5, 6) x[c(1, 3)] # using a numeric vector ``` ``` ## [1] 1 5 ``` ```r x[c(T, F, T, T)] # using a logical vector ``` ``` ## [1] 1 5 6 ``` ```r x[-3] # using a negative index ``` ``` ## [1] 1 3 6 ``` -- What is the result of `x[-c(1, 3)]`? <div class="countdown" id="timer_62b14ec1" style="right:0;bottom:0;" data-warnwhen="0"> <code class="countdown-time"><span class="countdown-digits minutes">01</span><span class="countdown-digits colon">:</span><span class="countdown-digits seconds">00</span></code> </div> --- # Named Vectors We can name each element of a vector ```r x <- c(1, 3, 5, 6) names(x) <- c("a", "b", "c", "d") x ``` ``` ## a b c d ## 1 3 5 6 ``` ```r x[c("b", "d")] # subsetting by name ``` ``` ## b d ## 3 6 ``` --- # Vectors ### Suppose we have test scores for 5 students: Bob, Alice, Alex, Juan and Amy. ### Their scores are 8, 7, 8, 10, and 5 respectively. 1. Create a vector of these scores. 1. Find the mean score in two ways (using `mean` and using `sum`). 1. Find the median score. 1. Assign the name of each student to their test score. 1. Retrieve Alice's score in two ways. 1. Retrieve Amy's and Alice's score, in that order. 1. Retrieve all except Amy's score. <div class="countdown" id="timer_62b14d02" style="right:0;bottom:0;" data-warnwhen="0"> <code class="countdown-time"><span class="countdown-digits minutes">10</span><span class="countdown-digits colon">:</span><span class="countdown-digits seconds">00</span></code> </div> --- # Style ## Typical R code :( .center[]  --- # Style ## Follow the tidyverse style guide A major part of coding is communicating with other developers. It is **very** important to adhere to a style convention. This is what I use and suggest. Take some time to look at chapters 1 - 3. https://style.tidyverse.org/ I thought about grading your code style but decided against it. But if your code is unreadable points will be deducted Consider using the [styler](https://styler.r-lib.org/) addin for RStudio. --- # Style In RStudio you should see a faint line at the 80 character mark. It is widespread coding practice across all languages to keep your lines of code under 80 characters per line. ```r x <- 1000 # Make sure you don't go past the 80 character mark or else your code might look like this and it will be hard for us to read. ``` --- # A note about comments ### Explain tricky code with comments, but do not overuse them. In my experience, a bad comment is worse than no comment at all. In this class, comments will sometimes be required for grading purposes. Assignment will say "Comment with the answer". ```r # assign to result the value of 45 plus 64 result <- 45 + 64 print(result) # print the result ``` ``` ## [1] 109 ``` ```r # Were the above comments really necessary? ``` --- # Summary - R Ecosystem - Vectors - numeric, character (strings), logical - Subsetting Vectors